Numbers can look clean and certain on paper. Real life isn’t. That’s where a critical value calculator quietly earns its place. It’s not flashy. It doesn’t try to impress. But if you’ve ever needed to decide whether a result actually means something—or if it’s just noise—you’ve brushed up against this idea already.
Here’s the thing: data alone doesn’t settle arguments. Interpretation does. And critical values sit right at that turning point between “interesting” and “statistically meaningful.”
Let’s unpack what that really means, without turning it into a lecture.
Why critical values matter more than you think
Imagine you’re testing a new feature on a website. You tweak a button color and suddenly conversions go up by 5%. Feels like a win, right?
Maybe. Maybe not.
A critical value helps you answer a blunt question: is that change big enough to trust, or could it just be random chance?
Without it, you’re guessing. With it, you’re grounding your decision in probability.
It’s easy to assume that any noticeable difference is meaningful. But randomness is sneaky. It produces patterns that look convincing. A critical value calculator steps in as a kind of filter. It separates signal from noise.
And that matters whether you’re in marketing, science, finance, or just trying to make sense of a spreadsheet at work.
What a critical value actually is (in plain terms)
Strip away the jargon and a critical value is just a cutoff point.
You’re drawing a line. On one side, results are considered normal variation. On the other, they’re unlikely enough that you start paying attention.
That line depends on a few things:
- How confident you want to be
- The type of test you’re running
- The amount of data you have
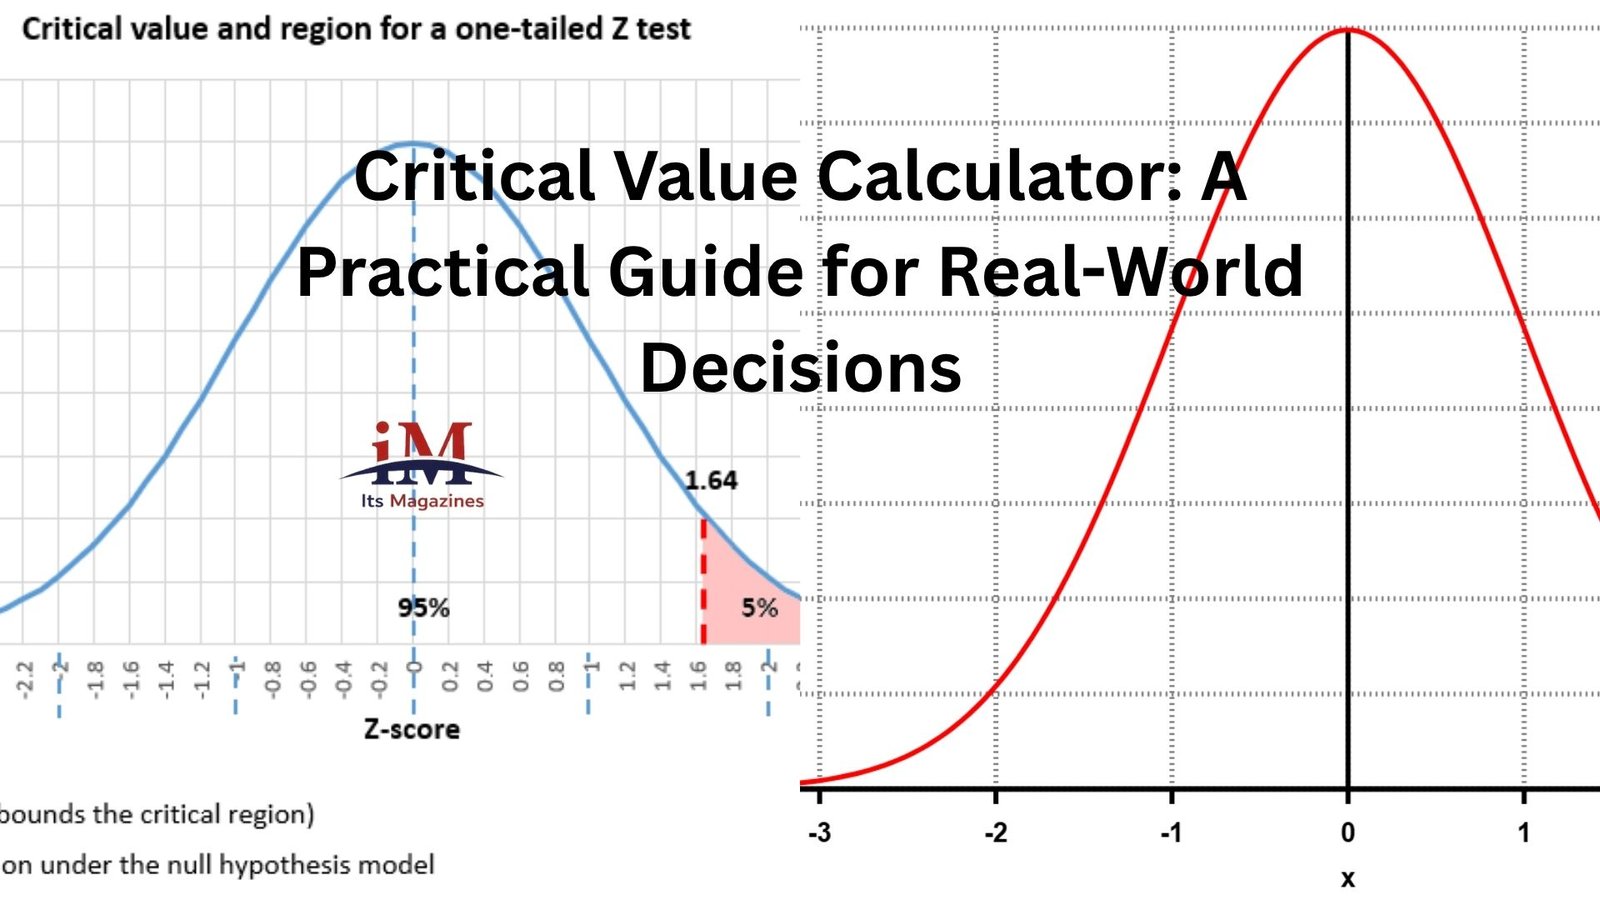
Let’s say you’re working with a 95% confidence level. That means you’re willing to accept a 5% chance of being wrong. The critical value is the number that marks that boundary.
If your test statistic crosses that boundary, you say, “Okay, this is probably not random.”
If it doesn’t, you hold back.
It’s not about certainty. It’s about reasonable doubt.
Where a critical value calculator fits in
You could look up critical values in statistical tables. People still do. But it’s slow, and honestly, a bit clunky.
A calculator handles the heavy lifting instantly.
You plug in:
- Your significance level (like 0.05)
- The type of distribution (z, t, chi-square, etc.)
- Degrees of freedom if needed
And it gives you the threshold.
That’s it. No flipping through tables. No squinting at tiny numbers.
But the real benefit isn’t speed. It’s confidence. You’re less likely to mess up the lookup, which means fewer quiet errors slipping into your conclusions.
A quick example that makes it click
Picture this.
You run a small online store. You test two versions of a product page. Version B performs slightly better—say, 52% conversion versus 50% for Version A.
At first glance, that looks like progress.
But you decide to run a hypothesis test. You calculate your test statistic, then use a critical value calculator.
Let’s say your critical value is 1.96 (common for a two-tailed test at 95% confidence).
If your test statistic is 1.2, you don’t cross the threshold.
Translation? That 2% bump could easily be random fluctuation.
It’s a little disappointing. But also incredibly useful. It stops you from making changes based on shaky evidence.
Now flip it.
If your test statistic is 2.5, you’re past the critical value. That’s when things get interesting. You’ve got a stronger case that Version B actually performs better.
Same data. Different interpretation. All because of one number.
Z vs T: the fork in the road
This is where people often hesitate.
Should you use a z critical value or a t critical value?
The short answer: it depends on how much you know about your data.
If you know the population standard deviation and have a large sample size, z is your go-to.
If you’re working with a smaller sample and estimating variability from your data, you’ll use t.
In real-world scenarios, t shows up more often than people expect. Especially in business settings where perfect information is rare.
The difference isn’t just technical. T distributions are a bit wider. That means your critical values are larger, and it’s slightly harder to declare something significant.
That’s not a flaw. It’s caution built into the math.
One-tailed vs two-tailed: a subtle but important choice
This part trips people up more than it should.
A one-tailed test looks for an effect in a single direction. For example, “Is this new design better?”
A two-tailed test is more open-ended: “Is this new design different at all?”
That choice changes your critical value.
With a one-tailed test, all your “risk” is placed on one side of the distribution. That makes it easier to cross the threshold.
With a two-tailed test, the risk is split. The bar becomes a bit higher.
Here’s where honesty matters.
It’s tempting to choose a one-tailed test after seeing your data, just to make results look significant. But that’s a shortcut that undermines the whole process.
Decide upfront. Stick with it.
Common mistakes that quietly ruin results
A critical value calculator is only as good as the inputs you give it.
And small mistakes here can lead to big misinterpretations.
One common issue is mixing up significance levels. Using 0.05 when you meant 0.01 changes your threshold quite a bit.
Another is using the wrong degrees of freedom. This happens a lot with t-tests. It sounds minor, but it shifts your critical value enough to matter.
Then there’s the misunderstanding of what “not significant” means.
It doesn’t mean “no effect.” It just means “not enough evidence.”
That’s a subtle distinction, but it’s important. Especially when decisions carry real consequences.
When to trust the result—and when to pause
Let’s be honest. Statistics can give a false sense of certainty.
Crossing a critical value feels definitive. But context still matters.
If your sample size is tiny, even a significant result can be shaky.
If your data is messy or biased, the clean math won’t save you.
A critical value doesn’t replace judgment. It supports it.
Think of it as one piece of a bigger puzzle.
If everything lines up—clean data, reasonable assumptions, strong test statistic—then you can lean on the result with more confidence.
If something feels off, it’s worth digging deeper.
Why this tool sticks with you once you learn it
A lot of statistical concepts come and go. You use them for a project, then forget them.
Critical values tend to stick.
Maybe because they tie directly to decisions. You’re not just calculating—you’re choosing whether to act.
That makes it memorable.
And once you get comfortable with it, you start seeing it everywhere.
A/B testing. Scientific studies. Financial modeling. Even casual data analysis.
Any time there’s uncertainty—and there’s always uncertainty—it has a role.
The quiet power of a simple threshold
There’s something almost understated about a critical value calculator.
It doesn’t analyze your data for you. It doesn’t tell you what decision to make.
It just gives you a line.
But that line carries weight.
It forces clarity. It pushes you to define how much risk you’re willing to accept. It makes your conclusions more transparent.
And in a world where data gets thrown around casually, that kind of discipline is rare.
Final thoughts
A critical value calculator won’t make your work perfect. It won’t eliminate uncertainty or guarantee the right decision.
What it does is sharpen your thinking.
It helps you slow down just enough to ask, “Is this result actually meaningful?”
That question alone can save time, money, and a lot of second-guessing.
Once you get used to using it, it stops feeling like a technical step and starts feeling like common sense.